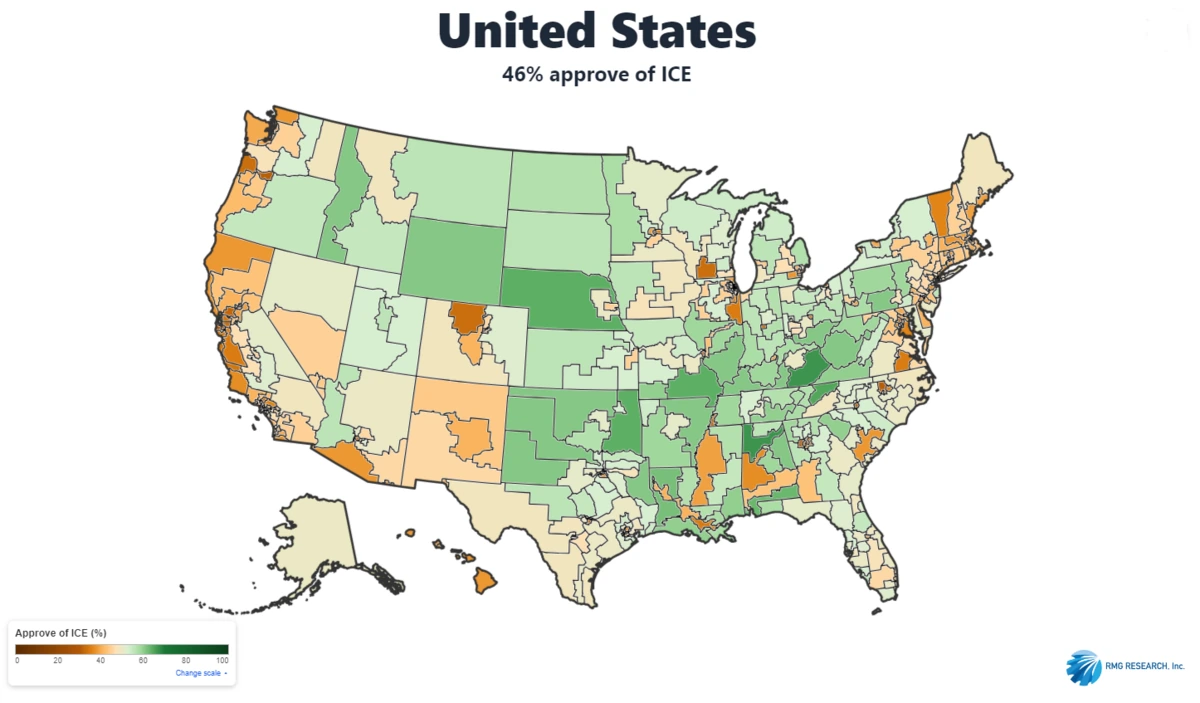
A Napolitan News survey revealed that overall, 51% of voters generally disapprove of ICE, while 46% generally approve.
On a state-by-state level, 22 states (plus the District of Columbia) have a majority who disapprove, while 19 have a majority who approve. The most disapproval among states comes from Maryland, Massachusetts, and Vermont, all with 61%. The most approval is from Wyoming (61%).
Congressional Districts
At a district level, 213 districts (plus the District of Columbia) have a majority who disapprove of ICE and 157 have a majority who generally approve. Other than the District of Columbia, which comes at 79% disapproval, the highest disapproval is a three-way tie between CA-12, PA-03, and WA-07 (77%). The highest approval goes to KY-05 (67%)
The Intensity Divide
On a state level and district level, the intensity of disapproval towers over the intensity of approval. Eighteen (18) states have Strong Approval over 30%. On the other hand, 39 states (plus the District of Columbia) have Strong Disapproval of over 30%. In fact, including D.C., 14 have a Strong Disapproval of over 40%.
In addition, 421 districts (plus D.C.) have a Strong Disapproval rating higher than a Strong Approval rating.
Washington, D.C.
Washington, D.C. has held a unique stance in many of the latest immigration findings. In the District of Columbia, 8 in 10 voters (79%) have an unfavorable view of ICE, nearly 30 points above the national average and 19 above any state.