 While immigration is a heated topic, a recent Napolitan News survey took a deep dive, gathering results from every congressional district in the country. The outcome is encouraging for those sick of partisan bickering. There is far more common ground on the topic than our nation's political dialogue suggests.
For instance:
All 435 congressional districts have at least 79% who say legal immigration is good.
All 435 congressional districts have at least 66% who say illegal immigration is bad.
The narrative, however, is being driven by fringe minorities who declare all immigration good or all bad.
Even on the topic of deportations, just 79 districts have a majority who say the number has gone too far. This, of course, does not mean they approve of the methods. There was significant divide on the topic of ICE. Overall 46% generally approve of the organization, and 51% generally disapprove. In addition, 421 districts (plus D.C.) have Strong Disapproval that surpasses Strong Approval.
What's the Summary?
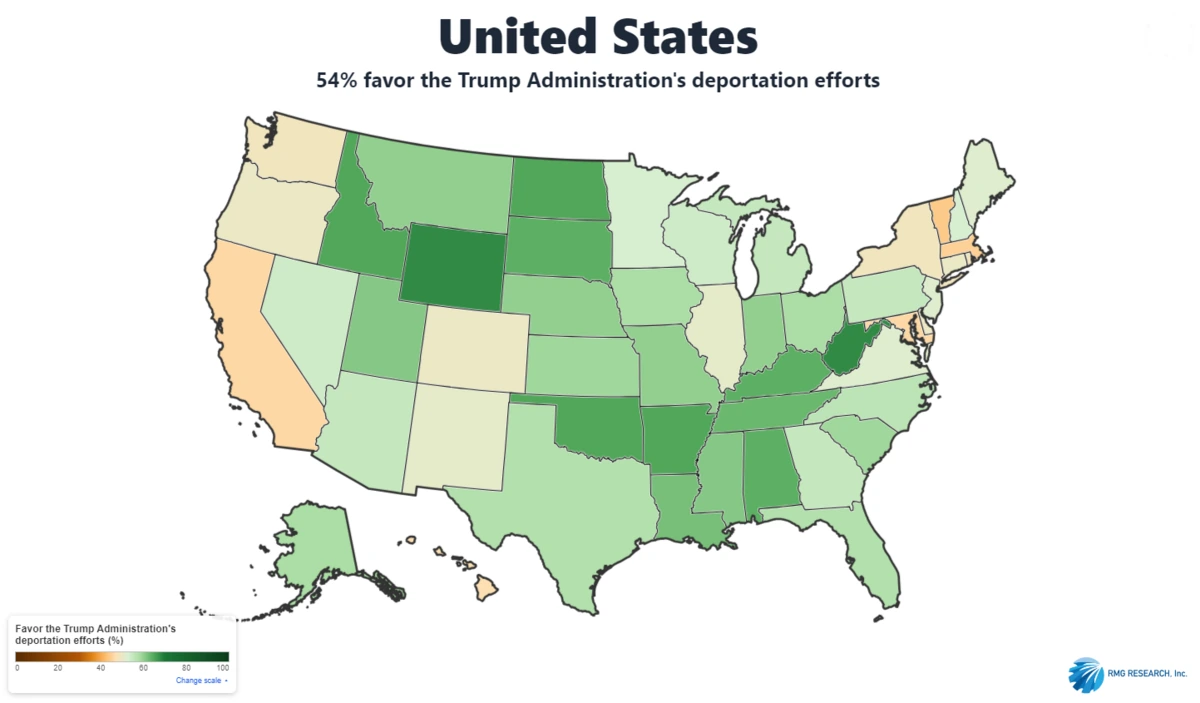
Today's data shows that just 74 congressional districts (plus the District of Columbia) have a majority who disapprove of the Trump Administration's deportation efforts. Those districts are split over 23 states. In contrast, 281 districts have a majority who approve of the administration's efforts, spread over 44 states.
State by State
On a state level, Vermont leads the opposition, with 51%. It is the only state with a majority who opposes the efforts, though California, Massacheusetts and Maryland come close (49%).
On the other hand, Wyoming is the most supportive state, with 68%.
Congressional Districts
On a district level, CA-12 leads the opposition, with 64% against the deportation efforts. Conversly, 75% of voters in KY-05 favor them.
Washington D.C.
As has been often noted in this week's data, Washington D.C. stands apart from the nation on many of these debates. In D.C., 66% oppose the Trump Administration's deportation efforts, while a meager 28% support them.
Next week, we will Napolitan News will release a summary of the differences on the topic of immigration between Washington, D.C. and the rest of the country.
The results for individual states and districts can be viewed as a map or data table.
The Precision Politics Geo-Targeting Application was developed by Scott Rasmussen in co-operation with Rajant Health.