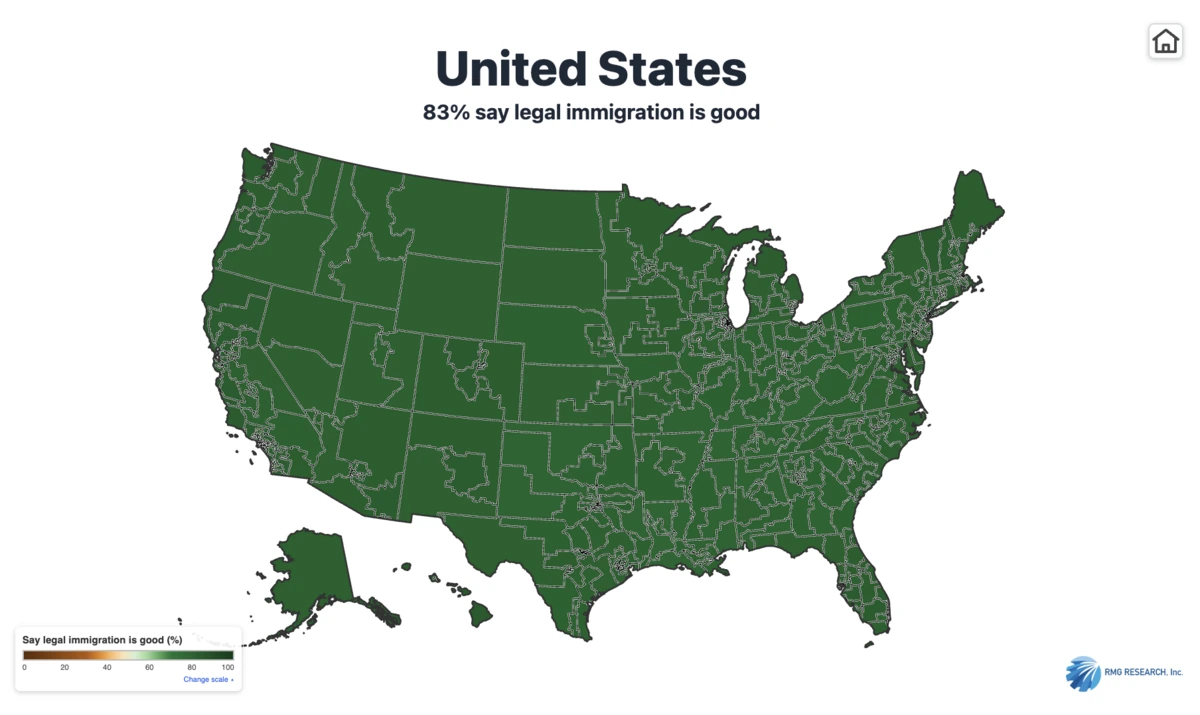
A Napolitan News survey found that at least 79% of voters in every state and congressional district believe legal immigration is good for America.
"These results highlight the deeply held consensus that America is both a nation of laws and a nation of immigrants," said Scott Rasmussen, President of RMG Research and founder of the Napolitan Institute. "The importance of immigration policy to defining a nation is demonstrated by the fact that the issue was one of the complaints lodged against King George III in the Declaration of Independence."
Overall, 83% of voters nationwide believe legal immigration is good for America, and just 12% believe it is bad. Rasmussen observed that "These numbers have been stable for decades, with roughly 8-out-of-10 voters consistently believing that legal immigration is good for America."
Some polls show that support for immigration varies over time, but such polling does not distinguish between legal and illegal immigration.
The share of voters saying legal immigration is bad for America ranged from a low of 7% (CA-11) to a high of 17% (KY-5). The state and congressional district results were provided by RMG's Precision Politics Geo-Targeting Application. This product collects rich demographic information from a large sample of voters. It then determines geo-targeted results using regression and post-stratification, a statistical technique that combines survey responses with census data.
The results for individual states and districts can be viewed as a map or data table. Additional state and congressional district data from the survey will be released through the week, starting tomorrow morning (Wednesday, August 12).
What Should Immigration Look Like?
It is important to recognize that voters believe legal immigration carries some entry requirements. Sixty-nine percent favor requiring immigrants to demonstrate that they can speak English before entering the United States, and 55% say requirements should include speaking English and demonstrating financial independence. Additionally, 57% say that we should give immigration preferences to people from cultures that share our basic values of human rights.